Project Summary
This project analyzes operational performance and data quality across clinical trial sites using a simulated multi-country dataset. As a Clinical Data Analyst, I built an Excel-based dashboard that tracks key metrics such as screening numbers, enrollment rate, randomization progress, screen failure rate, data query rates, and overall site performance. The dashboard provides real-time insights for study teams to identify risks early, improve site efficiency, and ensure high-quality clinical data.
Disclaimer:
All datasets used in this project are fully simulated and do not contain any real patient, site, or sponsor information. The dataset was intentionally designed to mimic real-world clinical trial operations, data structures, and performance trends while ensuring full compliance with GCP, HIPAA, GDPR, and clinical research confidentiality standards.
Problem Statement
Clinical trials rely heavily on timely enrollment, protocol adherence, and clean, accurate data. Study teams often struggle with:
- Slow or inconsistent enrollment across sites
- High screen failure rates
- Poor data entry timeliness
- High number of open/unresolved queries
- Variability in site performance
- Difficulty identifying high-risk regions or non-performing sites
This project solves these problems by developing a centralized Excel dashboard that gives CROs and sponsors instant visibility into operational and data quality performance.
Tools Used
- Microsoft Excel (Power Query, Pivot Tables, Interactive Slicers, Custom KPIs)
- Excel Formulas
- Conditional Formatting
- Data Modeling within Excel
Methodology (Step-by-Step)
- Data cleaning: removed duplicates, Standardized date formats, validated numeric fields, merged subject-level and site-level tables.
- Data Transformation in Power Query: loaded both datasets into power query, cleaned and normalized fields, created custom columns, created relationship between tables.
- KPI Calculation: screen failure rate, enrollment rate, query resolution rate, data entry lag, etc.
- Dashboard Development: pivot tables for performance metrics, pivot charts for trends, interactive slicers (Country, Site, Status), conditional formatting for risk flags
Dataset Description
The dataset contains two key tables:
- Site Performance Dataset (subject_ID, country, site_ID, screening_date, enrolled, randomization_date, enrollment_lag_days, last_visit_date, AE_count, queries_raised, queries_resolved, data_entry_status, screen_failure_reason)
- Subjects Enrollment Dataset (site_ID, country, screening_target, screened, enrollment_target, enrolled, screen_failures, AE_total, queries_total, queries_resolved, avg_data_entry_lag, withdrawals, enrollment_rate, AE_per_subject, SDV_percent,
Executive Summary
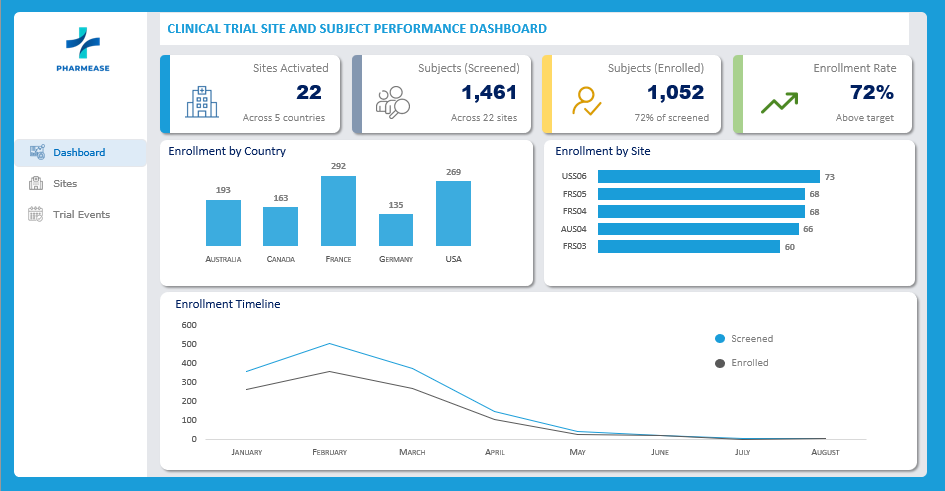
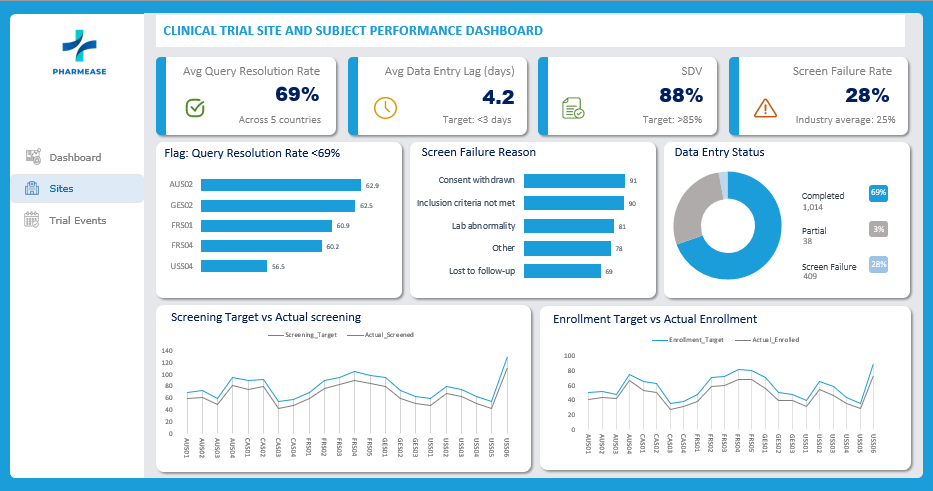
The clinical trial screened 1,461 subjects across 5 countries and 22 sites, resulting in 1,052 enrolled subjects (72% enrollment rate). While recruitment is strong, data entry timeliness in the USA and global query resolution rates (69%) are areas requiring attention.
Country-Level Performance Analysis
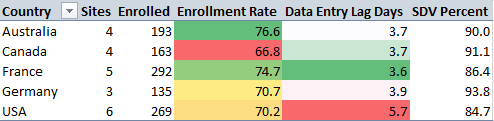
- Top Performer (Efficiency): Australia leads with the highest enrollment rate (76.6%) and maintains a low data entry lag (~3.7 days).
- Top Performer (Volume): USA contributes the most subjects (269 enrolled) but struggles with operational efficiency.
- Operational Bottleneck: USA sites have a significantly higher Average Data Entry Lag (5.7 days) compared to the global average (~3.8 days for other regions).
- Data Quality: Germany has the highest Source Data Verification (SDV) completion (93.8%), indicating strong site monitoring compliance.
Site Performance Analysis
The clinical trial is currently performing well against its recruitment goals, achieving 82.3% of the total enrollment target. However, operational discrepancies exist, particularly with data entry delays in US sites.
- Recruitment vs. Target: The study is approaching its goals but has not yet fully met the screening or enrollment targets. 1,461 subjects screened (83.9% of 1,742 target) and 1,052 subjects enrolled (82.3% of 1,278 target).
Site Efficiency and Operations
Top Performing Sites (Enrollment Efficiency) These sites convert screened patients to enrolled patients most effectively.
AUS03 (Australia): 85.7% Enrollment Rate
FRS05 (France): 81.0% Enrollment Rate
USS02 (USA): 80.6% Enrollment Rate
Operational “Watch List” (Slowest Data Entry) Immediate attention is required for sites with significant data entry lags, which risks data integrity and delays interim analysis.
USS01 (USA): 13.9 days lag (Critical – Global avg is ~4.2 days)
USS04 (USA): 9.6 days lag
GES02 (Germany): 4.2 days lag (Borderline)
Observation: The USA region has a significantly higher average lag (6.3 days) compared to all other regions, which average below 4 days.
Quality Control (Monitoring)
Source Data Verification (SDV): Germany leads with 93.7% SDV completion, indicating highly monitored and likely cleaner data. USA lags slightly at 83.2%.
Query Resolution: Canada sites are the most responsive, resolving 71.7% of queries. France is the slowest to respond at 66.5%.
Visual Dashboard
The dashboard visualizes these key comparisons:
Enrollment vs Target: Shows the gap remaining to hit 100% targets per country.
Screen Failure Reason: Highlights the most reasons for screening failure for all sites
Screen Failure Rates: Identifies which sites are screening many patients who ultimately do not qualify.
Business Impact
For Clinical Operations (ClinOps)
- Identify sites needing support or closure
- Improve recruitment strategies
- Allocate monitoring resources more efficiently
For Data Management
- Faster data cleaning
- Early detection of data issues
- Reduced time to database lock
For Sponsors
- Visibility into study health
- Transparency on enrollment performance
- Less risk of delays
Recommendations
- Targeted Intervention in USA: Investigate the root cause of the high data entry lag in USA sites. Additional resourcing or training may be required.
- Boost Query Resolution: With a resolution rate of only ~69%, the data management team should follow up with sites to close open queries, particularly before upcoming interim analyses.
- Re-train Sites: Share best practices from Australian sites (high efficiency) and German sites (high data quality) with the wider clinical team.