Tools Used: MySQL, Excel
Role: Clinical Data Analyst
Objective: Evaluate trial site drug accountability, detect discrepancies, and produce risk-based insights.
Project Overview
This project analyzes Investigational Product (IP) accountability across 15 global clinical trial sites. Using simulated dataset logs, I employed SQL to perform an auditable reconciliation, comparing expected versus actual inventory. The goal was to move beyond simple data reporting and utilize Central Monitoring principles to identify and prioritize high-risk sites that exhibit red flags for drug diversion, protocol deviation, or critical documentation failure.
Problem Statement
Investigational Product (IP) accountability is a primary focus of FDA inspections. Failure to account for every unit of dispensed drug can result in:
Regulatory Action: Warning letters (Form 483) for lack of control.
Patient Safety Risks: If lost drugs are diverted or expired drugs are dispensed.
Data Integrity Issues: If patients aren’t actually taking the drug (evidenced by lack of returns).
The objective was to move beyond manual spreadsheet checks and utilize SQL logic to systematically audit the flow of inventory from “Receipt” to “Destruction” across international sites.
Dataset Description
Scope: Inventory logs from 15 clinical trial sites across 7 countries.
Variables: Bottles_Recieved, Bottles_Dispensed, Bottles_Wasted, Tablets_Returned, Physical_Inventory_Count.
Data Preparation: The fully simulated dataset was ingested, cleaned, and modeled in SQL to compute core accountability metrics prior to visualization in Excel.
Methodology
The audit followed a risk-based monitoring (RBM) approach, focusing on three key areas: Inventory Integrity, Compliance Adherence, and Documentation Quality.
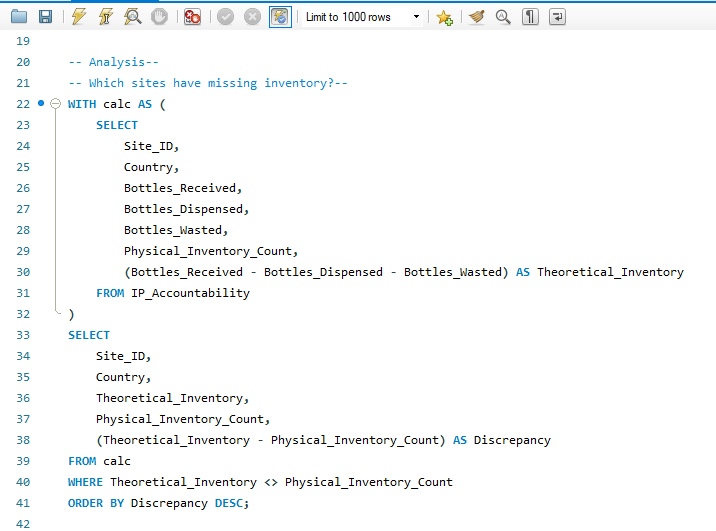
Computed Theoretical Inventory (SQL): Calculated the expected on-hand inventory using the formula:
Theoretical = Received – Dispensed – Wasted
Compared Theoretical vs Physical Inventory: Identified sites with discrepancies (where Theoretical is not equal Physical).
Ranked Sites by Return Rate: Assessed patient compliance by analyzing the ratio of returned tablets to dispensed bottles.
Identified Anomalies and Outliers: Used CASE logic in SQL to classify wastage documentation as Low, Medium, or Critical Risk.
Built an Excel Dashboard: Summarized all KPIs, visualizing the top 5 high-risk sites for stakeholder communication.
Sample SQL Logic
The core reconciliation query used to flag sites with unaccounted inventory (potential diversion):
Key Findings
The audit identified significant operational and compliance risks, allowing the monitoring team to prioritize their efforts:
Inventory Mismatch: 6 out of 25 sites showed a mismatch between Theoretical and Physical inventory counts.
Largest Discrepancy: The highest single-site discrepancy was 12 missing bottles (Flagged Site 009), representing the highest integrity risk.
Targeted Monitoring: 3 sites were flagged for immediate SDV (Source Data Verification) due to either missing product or poor returns compliance.
Anomalous Returns: Site 14 showed an unusually high return rate (above $98\%$), which is a compliance red flag (protocol states that only unused medication can be returned) and requires investigation to ensure sites are not manipulating logs.
Critical Documentation Risk: Site 009 was further classified as Critical Risk due to a high volume of wastage (10 bottles) accompanied by non-specific documentation.
Recommendations
The data-driven insights led to the following actionable strategy:
Conduct Targeted Monitoring: Immediately schedule a For-Cause Audit at Site 009 to investigate the 12 missing bottles and 10 poorly documented wasted bottles.
Align Site Logs with IWRS: Review the data entry process for Site 014 (high returns) and Site 005 (low returns) to ensure electronic logs align with the Interactive Web Response System (IWRS) records.
Retrain Site Staff on Drug Accountability SOPs: Issue a global notification and conduct mandatory retraining focusing on the proper logging of returns and ensuring a clear, auditable reason is recorded for every unit of wasted IP.
Review Storage and Dispensing Procedures: Investigate if storage conditions (e.g., temperature) contributed to the documented wastage at sites like Site 006.
Database Lock: Do not lock the final database until the 7 missing bottles at Sites 009 and 003 are explained (e.g., found under a shelf or declared officially lost).
Skills Demonstrated
SQL Analysis: Writing complex queries (including CASE WHEN logic) to automate critical audit functions.
RBM/Central Monitoring: Applying risk-based monitoring principles to prioritize site intervention based on objective data.
Data Visualization (Excel): Transforming raw database outputs into clear, executive-level dashboard insights.
Clinical Data Interpretation: Translating statistical anomalies (e.g., return rates) into specific protocol and compliance risks.
Communication of Insights: Structuring findings to deliver clear, actionable recommendations to Clinical Operations stakeholders.